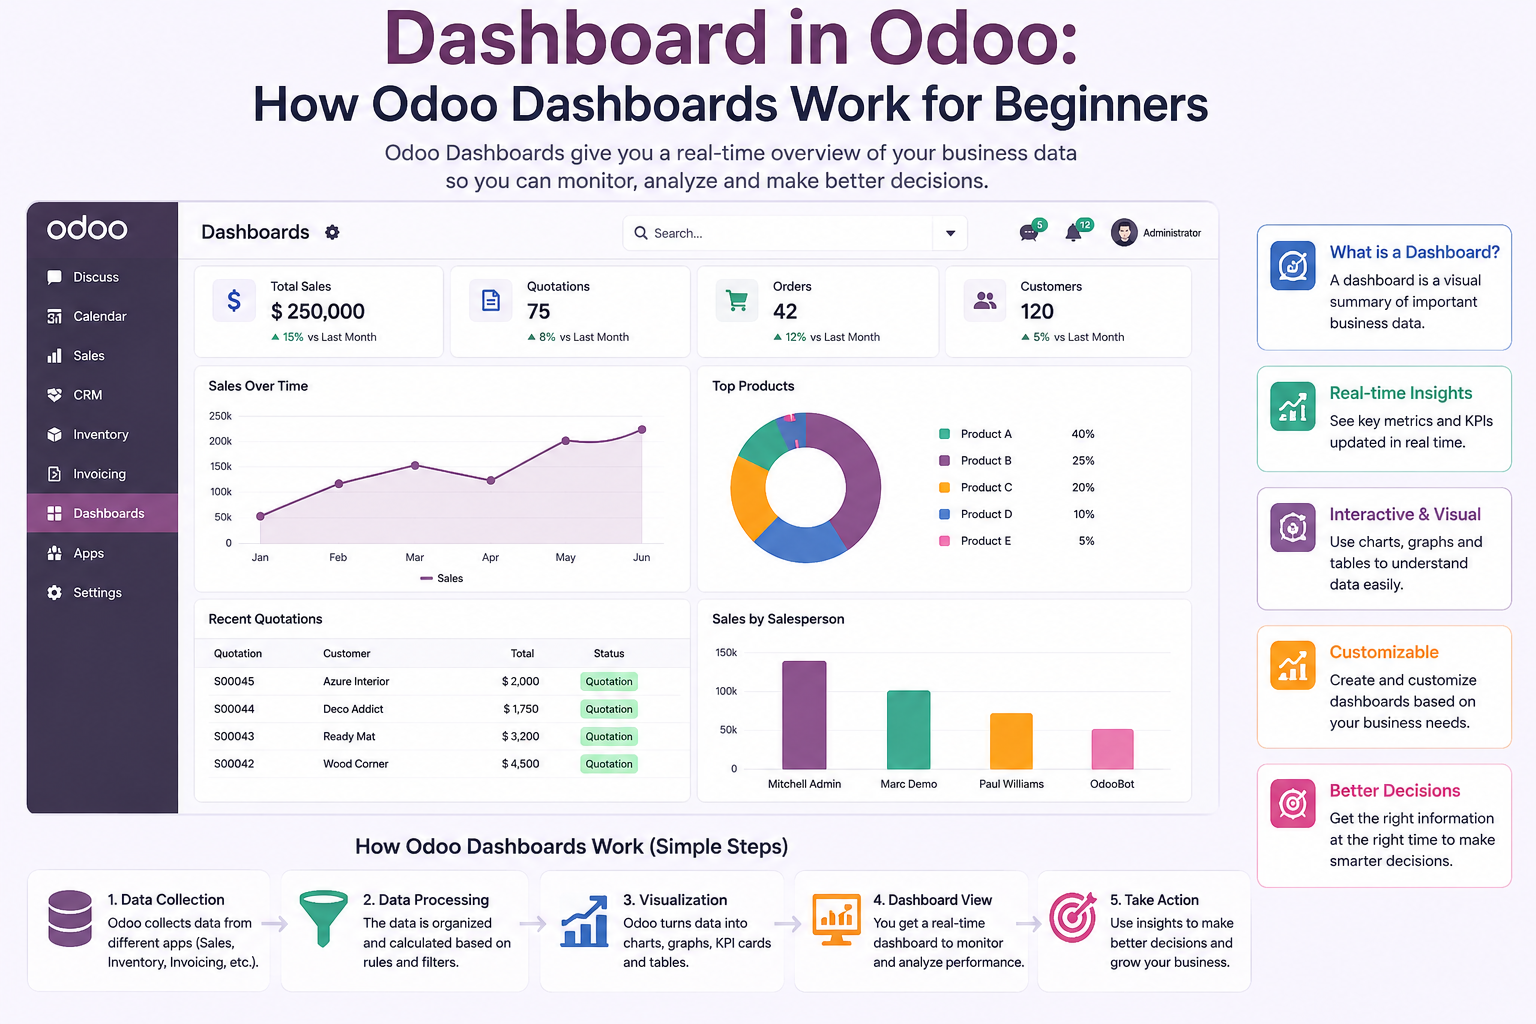
Odoo is kinda one of the most powerful business management platforms because it pulls together a lot of different business functions into one place, not just one tool. so whether you handle sales, inventory, accounting , HR, or even customer relationships, Odoo usually lets you organize it all from a single system. One of the most valuable parts is the dashboard inside Odoo, it gives you this visual snapshot of your business data, and it also helps people make quicker, more informed decisions.
If you are new to the platform , it really matters to understand how Odoo dashboards work for beginners, even if it feels a bit confusing at first. Dashboards make complicated reports feel simpler, they show charts, graphs, key performance indicators and real-time metrics in one interface that’s easy to read. This guide covers what you need to know about Odoo dashboards, and why they can improve day to day business operations, in a very practical way.
What Is a Dashboard in Odoo?
A dashboard in Odoo is like a visual work space that shows important business info in one spot, and honestly it feels kind of handy, because you do not need to keep opening a bunch of reports or jumping around between modules. instead users can quickly take a look at performance indicators, sales numbers, customer activities, inventory levels, financial bits and pieces, plus other critical metrics. In most cases the dashboard pulls data from different Odoo applications then it presents everything via charts, graphs, pivot tables, and those KPI cards that pop out at you. This more centralized approach saves a lot of time and it makes it easier for a business to keep checking how things are going, rather than manually crafting new reports every single day.
How Odoo Dashboards Work for Beginners
Understanding how Odoo dashboards work for beginners usually starts with this idea that each dashboard is kind of connected straight to the live business data that sits in the Odoo database. Whenever a transaction is recorded , an invoice is created, inventory changes happen, or a sales order is confirmed, the dashboard refreshes automatically. For beginners, it is not really necessary to have advanced technical knowledge , because most dashboards are already built into the Odoo modules. Users just open the right application, pick the reporting options they want ,and then view the updated business info shown in a pretty clear, interactive way.
Main Components of an Odoo Dashboard
An Odoo dashboard has multiple visual bits that , kind of help business data feel more clear. You’ll see KPI cards with the key figures, plus graphs that show trends over time. There are also pie charts for comparing categories, bar charts used for performance analysis, and pivot tables for more detailed reporting, not to mention filters that let users adjust what they want to view, right there. All these pieces work together to take raw business data and turn it into meaningful insights . So users can spot patterns sooner, keep an eye on growth , and notice operational issues before they turn into bigger problems.
Why Beginners Should Use Odoo Dashboards
New Odoo users often run into trouble with lots of business info, scattered across various modules. Dashboards sort of solve that headache by pulling all the key data together in one place, so it feels less scattered. Rather than going through super long reports, beginners can grasp what’s happening with business performance using visual summaries, which are honestly easier to read at a glance. This kind of approach shrinks the learning curve a bit, and at the same time helps people get comfy with Odoo’s reporting options. Little by little, those dashboards build confidence in the workflow, and they also make deciding things faster and more on point.
How Different Odoo Modules Use Dashboards
Every major Odoo application includes dashboards, kinda made for its own purpose, and you can see it right away. The Sales dashboard tracks quotations, revenue, and also customer activity. The Accounting dashboard gives financial summaries, invoices, and payment status. Inventory dashboards monitor stock availability, warehouse operations, and product movements. CRM dashboards show lead generation , sales pipelines, and conversion rates. HR dashboards present employee information and attendance statistics. Even if each module hovers around different data , they still line up with the same dashboard idea, basically putting business information into a clear visual format , so it’s easier to understand.
Customizing a Dashboard in Odoo
One of the biggest advantages with Odoo dashboards is the kind of flexibility that really lets you breathe. In practice, businesses can customize dashboards to fit their own, particular reporting needs, which is sort of the point. Users are able to put filters in place, pick specific date ranges, shuffle the charts in a more sensible order, add favorite reports and show only those metrics that actually matter for day to day operations. For teams that have advanced requirements, they can even build totally custom dashboards, either through Odoo Studio or using Business Intelligence tools. That way, each department gets the right info without the extra noise.
Benefits of Real-Time Reporting in Odoo Dashboards
Real time reporting is one of the strongest points in an Odoo dashboard. Each business transaction updates the dashboard immediately, so the delays that come from manual reporting kind of disappear. Managers always get to see the latest on sales numbers, financial details, stock levels, and day to day performance. This real time view gives organizations a chance to react fast to market shifts, spot new patterns early, and fix operational problems before they start bothering customers or hurting profitability. With information that stays current and reliable, planning gets cleaner and business decisions become more informed.
Common Mistakes Beginners Should Avoid
Many beginners think dashboards are meant to replace full reports completely, but in reality dashboards are more like quick summaries, not the whole set of transaction details. Another common error is to show too many charts in the same view, so people end up squinting and it becomes hard to interpret. Instead, teams should really stick to the most critical KPIs, those that actually support business goals in a direct way. Also, if you ignore filters, or you forget to update the dashboard preferences, the numbers can quietly become less accurate. Learning how to keep dashboards simple, still relevant, and organized in a sensible structure helps users get maximum value from Odoo reporting capabilities.
Best Practices for Using Odoo Dashboards
To get the best results, businesses should do regular reviews of dashboard metrics, keep an eye on trends not only isolated numbers, and adjust reports based on what each department actually needs. Decision-makers, should take what the dashboards show and merge it with the deeper detail from detailed reports whenever deeper analysis is required. Employees too should get proper training, so they really understand what each KPI means and how it can impact business performance. If you follow these things consistently, the dashboards start acting like useful management tools, and not just a simple set of visuals.
Conclusion
Learning how Odoo dashboards work for beginners is one of the first step i’d say toward getting comfortable with the Odoo platform. A good dashboard in Odoo, turns complicated business data into clean visual insights that boost productivity, reporting accuracy, and frankly faster decisions. If you handle sales, accounting, inventory, CRM , or human resources, dashboards give you quick access to the stuff that really matters. And as your organization grows, customized Odoo dashboards get even more useful because they help teams track performance, spot chances and act with confidence, all through real-time data.