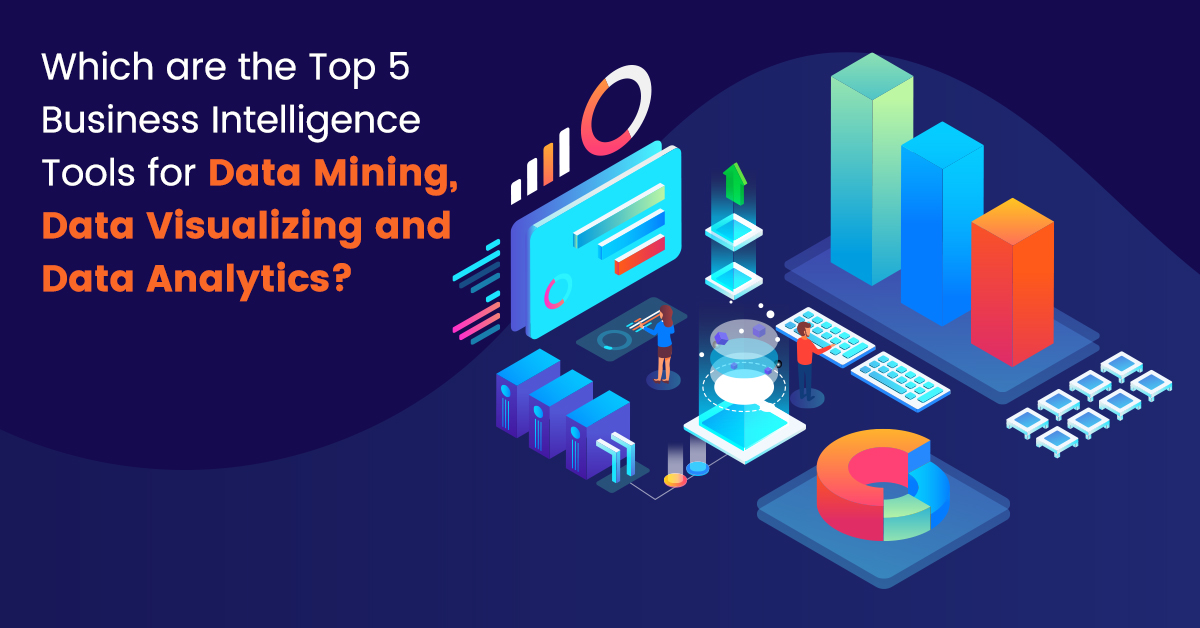
Introduction
When it comes to business intelligence (BI) tools, there are many options available. Some platforms are highly technical and powerful, while others are user-friendly and lightweight. Choosing the right tool for your business depends on several factors, such as your current state, your desired outcome, who needs access to the data, and your tech stack.
Selecting the appropriate Business Intelligence tool is a complex process involving many stakeholders’ inputs. However, you can start by exploring the significant players in the market to understand better what they offer.
Defining Data Mining
Data mining is extracting and refining raw data to make it more suitable for analysis. By analyzing this data, businesses can make better plans, understand customer and competitor behavior, provide the best costs, and improve operational efficiency. This term is derived from the English phrase “data mining” and is used in various fields depending on an organization’s business activities. These activities may include monitoring their resources for product development, researching consumer demand, examining competitors’ pricing strategies, and other relevant work.
Defining Data Visualization Tools
Mining data might be challenging and expensive if you wish to create your tools. Your option in this situation will be to employ pre-made solutions to address your company’s challenges. If you cannot access free programmers, your only available resource is a business team that can employ pre-made solutions.
Let’s examine the outstanding collection of instruments that you may quickly incorporate into your operational procedures. Let’s start with a tool for gathering data before moving on to business intelligence (Bi) tools for integrating, visualizing, and analyzing that data.
Data Gathering Method called Scraping
Although other data-collecting methods are available, our team has developed custom scraping to be a complete DaaS (data as a service) solution.
Describe Parsing
We can get information from any website on the Internet via scraping. We will deliver the data you want in a “pick-and-play” format that smoothly integrates with your business process after you have given us the specifications.
- Customization for your duties – our staff will collect data for you when you submit a list of sites with various entry points (regions, segments, relevant data, etc.)
- Fully adaptable procedure – we will create, implement, and manage the procedure, from establishing the parser to run at the chosen frequency to cleaning and matching data.
- We offer dedicated support and quick assistance to ensure your company runs smoothly around the clock.
- Our staff will handle routine data updates at the desired frequency after setting up the procedure.
- Convenient data transmission format and procedure – we transform data into an accessible format.
List of Business Intelligence Tools
1. Yandex DataLens
Based on the Yandex.Cloud commercial platform, Yandex service
Yandex DataLens features include:
- Import data from PostgreSQL, ClickHouse, MySQL, Yandex, and CSV files. Metrica has a total of 29 connections;
- constructing charts, tables, and graphs, and presenting the information on a single dashboard;
- exchange of data
- a cloud-based workspace;
- instructions for securing different connections together.
Flaws: There are fewer connections than competitors;
Billing:
- Free package for small-team requirements;
- dependent on the resources used, a paid tariff;
2. Power BI
Microsoft offers a business intelligence platform, with the Pro version exclusively available to users of Office 365 Enterprise.
Power BI attributes
- extract data from 348 sources, including databases, CSV files, and Excel;
- constructing graphs, charts, and tables, and displaying their data in real-time on a single dashboard;
- exchange of data
- a rapid introduction for anyone familiar with the Windows ecosystem;
- integration with Microsoft Excel, Azure Cloud Service, and desktop and cloud versions of SQL Server.
Flaws:
- Dealing with data from the systems of Google and Yandex presents difficulties;
- They are launching issues with the desktop version.
Billing:
- Free rates;
- “Paid fare” refers to the chance to access premium services and gain exclusive entry.
3. Google Data Studio
Google offers a free and straightforward data visualization service.
What Google Data Studio offers:
- import information from 208 plug-in partner connections and 16 Google services;
- integration with Google Goods that is quick and simple;
- constructing charts, tables, and graphs, and displaying their data on a single dashboard;
- We are working together, using the cloud.
Flaws:
When the data allotment is reached, certain partner connections start receiving payments.
Billing: Free
4. Tableau
This is a tool for analyzing and visualizing strong and rapidly expanding data.
Tableau includes
- 84 pluggable connectors, such as databases, CSV, and Excel;
- the capacity to mix data from several sources;
- constructing charts, tables, and graphs, and displaying their data on a single dashboard;
- Collaboration;
- a simple UI;
- versions for desktops, clouds, and servers.
Flaws:
The premium rates are expensive, while the free version is vulnerable to data exposure.
Billing:
A paid package is available for both desktop and server versions, but there is also a free cloud version. However, users must agree to disclose their data to use the free version.
5. Visual.ly
One of the data visualization technologies available today, Visual.ly is famous for its remarkable distribution network that displays project results. Visual.ly accelerates the process of data import and outsourcing, even to third parties, by using a specialized creative team for data visualization services.
The advantages of Visual.ly:
- superior output quality
- Easy to create excellent graphics
- Several options for links
Cons of Visual.ly:
- Limited embedding choices
- demonstrates a single point, not several points
- restricted range
Summary Nowadays, any company that wants to expand must have data visualization systems and business intelligence solutions. Organizations need to consider the pros and cons of each option to pick the right tool for their needs. They should also consider the project’s goals and scope and the features and qualities of the available platforms.